Cassandra garbage collector tuning has been a hot topic of discussion in the Cassandra user mailing list from time to time. Users and administrators are required to gain some skills on how to properly tune the garbage collector for their Cassandra nodes so that they can avoid long stop the world pauses that can bring their cluster to halt. Although out of the box garbage collector settings work for most use cases, as the data volume and request traffic per Cassandra node increases, the demand for tuning garbage collector increases also. In this article I’ll explain how you can analyze your Java Virtual Machine and optimize its heap size and settings for your use case. Some of the techniques described here can be applied to tuning any application running on JVM, but majority of them only apply to the way Cassandra works.
Background
Since AWS has launched the beefy hi1.4xlarge instances with SSDs, and Netflix has published a great benchmark of Cassandra performance with them, they became very popular among Cassandra community, and I decided to go through the path of shrinking the Cassandra cluster to fewer nodes utilizing the power of these instances. The initial 24 node cluster was pretty much running with vanilla GC settings that shipped inside cassandra-env.sh. Due to the fact that the 6 nodes had to handle 4 times as much workload, Cassandra garbage collector tuning became important to me and I had to learn and change some settings so that the nodes can utilize the power of their beefed up hardware. These changes included several JVM settings, and at the end I had to actually increase the size of JVM Heap from 8Gb to a mighty 24Gb to maintain the low SLAs and 95th percentiles bellow 200ms.
Problem
Your clients are timing out for a closed period of time. If you are lucky this period would not be bigger than a few hundred milliseconds, however by the time people usually complain, this period has gone beyond seconds which is a really bad behavior for the database layer. The only assumption I am making here is that these timeouts are due to Garbage Collector Stop the World pauses and not other issues such as CPU or I/O saturation. In my case I was able to produce a handful of multi-second stop the world GCs during my load test throughout a day. Hence Cassandra Garbage Collector tuning became a new topic of interest to me.
When Garbage Collector Stop the World pauses are the culprit?
Garbage collectors like Concurrent Mark and Sweep (CMS) and Parallel New (ParNew) will always have stop the world pauses. Usually the pause is small enough that is not noticed by the application. However, the pause can be long enough such that it makes the application unresponsive. As the first step, we need to implement adequate logging and monitoring for our system because you want to be able to reference history of events when the issues occur and trying to watch metrics with tools that show current state of application may not be sufficient. Java provides a nice facility that can log very detailed information about the heap statistics and garbage collector performance. Out of the box Cassandra by default ships with a set of GC logging parameters that are originally disabled in cassandra-env.sh. I highly recommend everyone to enable those on their production clusters. In addition to the default logging options, I’ll recommend enabling these flags as well:
JVM_OPTS="$JVM_OPTS -XX:+PrintSafepointStatistics"
JVM_OPTS="$JVM_OPTS -XX:+PrintClassHistogramBeforeFullGC"
JVM_OPTS="$JVM_OPTS -XX:+PrintClassHistogramAfterFullGC"
The histogram in particular will be very helpful because usually at the time that you have long pauses, you want to see what objects are consuming most of the heap, and the histogram will provide you with the answer to that.
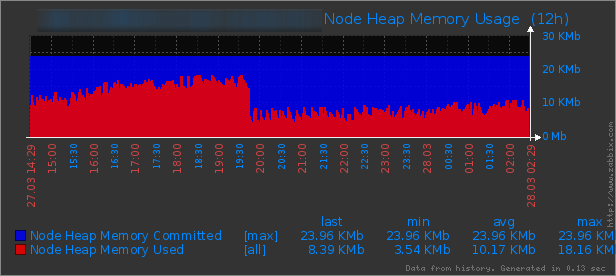
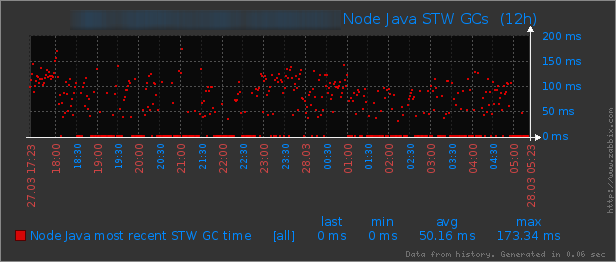
There are other tools you can use to monitor the heap space such as jstat and I recommend using them. If you are fancy you can parse, collect, and plot the data from these tools and logs into your monitoring application. In my case, I plot both stop the world GC times from the logs, which is the most accurate stop the world metric, as well as how the generations inside the heap are utilized from jstat:


In the top graph we see that a little before 16:00 there is a sharp cliff in the heap space used. This means that CMS Collector kicked in. You can see that it kicked in around 6Gb heap usage which is 75% of total 8Gb. You also see another cliff before 21:00 which is deeper. The 75% is based on the GC flag which is set inside cassandra-env.sh as CMSInitiatingOccupancyFraction=75. It tells JVM to force CMS to run a full sweep if heap is filled up at least 75%. This process doesn’t always take too long. As you see in the bottom graph, only the first cliff caused a stop the world GC of about 15 seconds which is terrible, but the second one didn’t despite it being able to free up more space. Long pauses are usually caused by full GCs. And full GCs happen when CMS cannot collect enough objects concurrently hence it falls back to the Parallel algorithm, pauses and scans all objects in the heap. I’ll talk more about this later in the heap crash-course.
No Graphs, Don’t worry! There are logs with this information
If you don’t have the fancy graphing tools, or even forgot to turn on GC logging options in cassandra-env.sh, Cassandra’s system.log will log every stop the world GC that took more than 250ms as long as you did not reduce the logging severity to something less than INFO in log4j-server.xml. You will see log lines like this:
In the GC log you will find something like this:
Congratulations. You have just found out that you have a problem with super long GC pauses. Hence the rest of this article become relevant to you.
Understanding Java Garbage Collection
I highly recommend you to read Understanding Java Garbage Collection which is really well written in my opinion as I am not going to duplicate this great article here. It will help you understand how the JVM heap is setup and how different GC algorithms work. Then head back here and I will walk you through scenarios that can cause Cassandra to have long GC pauses.
Cassandra Garbage Collector Tuning
The basic takeaway from the Understanding Java Garbage Collection is that Garbage Collection process works best with the assumption that most objects become unreachable soon and there are small number of objects referenced in between old generation and new generation. If these two assumptions are violated we end up with slow GC performance. So, for Cassandra we think about how objects end up being long lived in the heap leading to this scenario. It is more efficient for objects to expire in the young generation than having to get promoted to the old generation and cleaned up there with a full GC cycle. There are usually two scenarios in which GC algorithms fail and fall back to the full parallel stop the world GC which is the case for super long pauses:
Premature Tenuring leading to ParNew Promotion Failures
Premature Promotions is when objects don’t live long enough in the young generation before they expire. This causes the ParNew cycles to promote them to the old generation. The more objects get promoted to the old generation like this, the more fragmented heap will get. As a result there won’t be enough room in old generation for young objects and ParNew will fail with Promotion Failure.
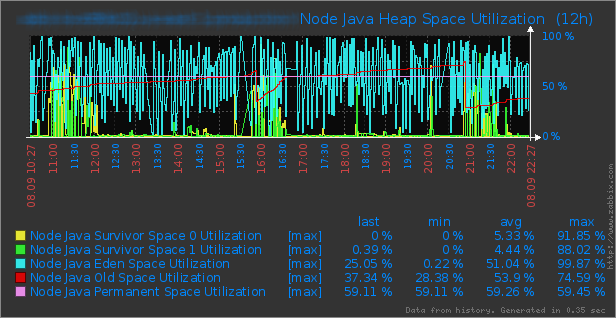
The following graph shows the percentage utilization of different generations inside the heap space. The blue line which is like a saw, is the Eden space. On average 51% of eden is utilized which is normal. But if you look at survivor space utilizations, you notice they are utilized 5% on average. There is a cliff on the old space utilization before 16:00 which co-relates to our slow GC. This means that although the survivor spaces seem to be filled 50%, the old generation keeps filling up earlier than survivors. This means that there is opportunity to tune the young generation as we have a premature tenuring. Heavily loaded servers specially serving thousands of read requests can easily fall into this scenario.

This can be observed from the GC logs as well:
<p style="text-align: justify;">3109400.009: [ParNew (0: promotion failure size = 9564) (2: promotion failure size = 180075) (3: promotion failure size = 8194) (5: promotion failure size = 8194) (8: promotion failure size = 180075) (9: promotion failure size = 8194) (promotion failed)
Desired survivor size 41943040 bytes, new threshold 1 (max 1)
- age 1: 78953120 bytes, 78953120 total
: 736942K->737280K(737280K), 0.4781500 secs] 5904031K->5961105K(8306688K)After GC:
Statistics for BinaryTreeDictionary:
------------------------------------
Total Free Space: 254740045
Max Chunk Size: 5168
Number of Blocks: 180395
Av. Block Size: 1412
Tree Height: 183
After GC:
Statistics for BinaryTreeDictionary:
------------------------------------
Total Free Space: 283136
Max Chunk Size: 283136
Number of Blocks: 1
Av. Block Size: 283136
Tree Height: 1
, 0.4798500 secs] [Times: user=1.13 sys=0.00, real=0.48 secs]
Heap after GC invocations=152713 (full 89):
par new generation total 737280K, used 737280K [0x00000005fae00000, 0x000000062ce00000, 0x000000062ce00000)
eden space 655360K, 100% used [0x00000005fae00000, 0x0000000622e00000, 0x0000000622e00000)
from space 81920K, 100% used [0x0000000622e00000, 0x0000000627e00000, 0x0000000627e00000)
to space 81920K, 99% used [0x0000000627e00000, 0x000000062cdab9f8, 0x000000062ce00000)
concurrent mark-sweep generation total 7569408K, used 5223825K [0x000000062ce00000, 0x00000007fae00000, 0x00000007fae00000)
concurrent-mark-sweep perm gen total 60640K, used 36329K [0x00000007fae00000, 0x00000007fe938000, 0x0000000800000000)
}
GC locker: Trying a full collection because scavenge failed</p>
<p style="text-align: justify;">
CMS Concurrent Mode Failure
There are several reason for CMS to return a concurrent mode failure. Read the Understanding CMS GC logs to familiarize yourself with all of them. The most common one is when the application is allocating large objects and CMS gets interrupted in the middle of its work because the tenured generation fills up faster than it is cleaned up. A few bad designs and uses of Cassandra may lead to this. If you have concurrent mode failure it will be logged in your GC log:
(concurrent mode failure)CMS: Large block 0x00000006992e3d78
The large block specifically is a sign that there is a large object in the heap.
Cassandra Heap Pressure Scenarios
There are several cases in which you will have a heap pressure. I have personally experienced all of them. In this section I will describe each scenario in the order based on the frequency that Cassandra users report them. It is advised that you troubleshoot and get to the root cause before trying to implement solutions in a trial and error fashion. The following assumptions are made based on defaults settings of Heap and GC in cassandra-env.sh:
- Maximum heap size is 8Gb;
- Young generation (NewGen) is going to be calculated by cassandra-env.sh to be 1/4 of the heap;
- Therefore, the young generation size will be 2Gb;
- SurvivorRatio is 8 which makes the ratio of each survivor space to eden to be 1:8. Hence each survivor space will be 1/10 of the NewGen which will be 200Mb;
- This concludes Eden space to be 1600Mb;
- TenuringThreshold is 1 which means after one young generation GC cycle, objects will be promoted to tenured space;
- Memtables are using 1/3 of the heap which is 2.6Gb;
- Row Cache is off; or if it is enabled, you will be using SerializingCacheProvider which stores information outside of heap;
- Key Cache is using 100Mb;
Aggressive Compactions
By default Cassandra will run one compaction thread per CPU core available. During the compaction process, Cassandra will read each row at a time from all SSTables that it belongs to, it cleans up tombstones if they are expired beyond gc_grace_seconds, and sorts the columns and writes the row back into a new SSTable. It does this process all in memory up to the value of in_memory_compaction_limit_in_mb in cassandra.yaml which is 64Mb by default. Now if your NewGen size is 2Gb on a 16 core machine, you can have up to 64Mb x 16 = 1Gb of heap filled up with columns from compaction threads. Depending on how your compaction is throttled, these objects can live longer in heap and be quickly promoted to the old space causing it to get filled up. If you are running a high CPU machine with the default heap settings, this can easily hit you. It is hard to absolutely pin the problem to compaction but with instrumentation in Cassandra code you can make that conclusion.
Let’s say a slow stop the world GC has happened and you have a histogram of objects inside the heap from GC logs:
Histogram Before GC:
----------------------------------------------
1: 13760719 4137773696 [B
2: 7745592 371788416 java.nio.HeapByteBuffer
3: 445843 149064744 [J
4: 2237102 139165560 [Ljava.lang.Object;
5: 3709467 118702944 org.apache.cassandra.db.Column
6: 1225225 117621600 edu.stanford.ppl.concurrent.CopyOnWriteManager$COWEpoch
7: 1616600 77596800 edu.stanford.ppl.concurrent.SnapTreeMap$Node
8: 1519971 67141976 [I
9: 1576078 63043120 java.math.BigInteger
10: 2528181 60676344 java.lang.Long
11: 2494975 59879400 java.util.concurrent.ConcurrentSkipListMap$Node
12: 1235423 59300304 edu.stanford.ppl.concurrent.SnapTreeMap$RootHolder
13: 1938545 46525080 java.util.ArrayList
14: 1912334 45896016 java.lang.Double
15: 1225225 39207200 edu.stanford.ppl.concurrent.CopyOnWriteManager$Latch
16: 13951 37558032 [[B
17: 912106 36484240 java.util.TreeMap$Entry
18: 1139680 36469760 java.util.ArrayList$Itr
19: 222470 35978688 [C
Histogram after GC:
<p style="text-align: justify;">num #instances #bytes class name
----------------------------------------------
1: 7728112 1142432184 [B
2: 48827 100400768 [J
3: 1072172 51464256 java.nio.HeapByteBuffer
4: 8801 30603624 [[B
5: 425428 20420544 edu.stanford.ppl.concurrent.SnapTreeMap$Node
6: 483982 19359280 java.util.TreeMap$Entry
7: 104987 14104448 [C
8: 523857 12572568 java.lang.Double
9: 250248 10009920 org.apache.cassandra.db.ExpiringColumn
10: 50021 7251040 <constMethodKlass>
11: 221730 7095360 java.util.HashMap$Entry
12: 50021 6814168 <methodKlass>
13: 5086 5767408 <constantPoolKlass>
14: 49322 4734912 edu.stanford.ppl.concurrent.CopyOnWriteManager$COWEpoch
15: 140638 4500416 org.apache.cassandra.db.Column
16: 86506 4170536 [I
17: 5086 3636632 <instanceKlassKlass>
18: 4532 3520640 <constantPoolCacheKlass>
19: 31370 3396504 [Ljava.util.HashMap$Entry;
20: 211417 3382672 java.lang.Integer
21: 77307 3092280 java.math.BigInteger
22: 119683 2872392 java.util.concurrent.ConcurrentSkipListMap$Node
23: 53716 2578368 edu.stanford.ppl.concurrent.SnapTreeMap$RootHolder
24: 5819 2574720 <methodDataKlass>
The histograms are much longer; I am pasting the top part which is usually the most useful. You can see that before GC runs, heap had 113Mb of Columns. It seems a large number for an entity which should rapidly go in and out of the heap. Columns are barebones of data storage in Cassandra code, so there could be many sources:
- Wide tow read with lots of columns (more on this later);
- Compaction reading rows to compact;
- Repair (Validation Compaction) reading columns to form Merkle Tree;
First you want to rule out the wide rows which is usually an application issue. Then you can figure out if it is compaction. If you have coding skills, you can add instrumentation to sample Column object’s instantiations to see what process instantiating so many Column objects:
<p style="text-align: justify;">INFO [CompactionExecutor:630] 2013-08-21 12:16:00,010 CassandraDaemon.java (line 471) Allocated a column
java.lang.Exception: Sample stacktrace
at org.apache.cassandra.service.CassandraDaemon$3.sample(CassandraDaemon.java:471)
at org.apache.cassandra.service.CassandraDaemon$3.sample(CassandraDaemon.java:468)
at com.google.monitoring.runtime.instrumentation.ConstructorInstrumenter.invokeSamplers(Unknown Source)
at org.apache.cassandra.db.Column.<init>(Column.java:78)
at org.apache.cassandra.db.ColumnSerializer.deserializeColumnBody(ColumnSerializer.java:109)
at org.apache.cassandra.db.OnDiskAtom$Serializer.deserializeFromSSTable(OnDiskAtom.java:92)
at org.apache.cassandra.db.ColumnFamilySerializer.deserializeColumnsFromSSTable(ColumnFamilySerializer.java:149)
at org.apache.cassandra.io.sstable.SSTableIdentityIterator.getColumnFamilyWithColumns(SSTableIdentityIterator.jva:234)
at org.apache.cassandra.db.compaction.PrecompactedRow.merge(PrecompactedRow.java:114)
at org.apache.cassandra.db.compaction.PrecompactedRow.<init>(PrecompactedRow.java:98)
at org.apache.cassandra.db.compaction.CompactionController.getCompactedRow(CompactionController.java:160)
at org.apache.cassandra.db.compaction.CompactionIterable$Reducer.getReduced(CompactionIterable.java:76)
at org.apache.cassandra.db.compaction.CompactionIterable$Reducer.getReduced(CompactionIterable.java:57)
at org.apache.cassandra.utils.MergeIterator$ManyToOne.consume(MergeIterator.java:114)
at org.apache.cassandra.utils.MergeIterator$ManyToOne.computeNext(MergeIterator.java:97)
at com.google.common.collect.AbstractIterator.tryToComputeNext(AbstractIterator.java:143)
at com.google.common.collect.AbstractIterator.hasNext(AbstractIterator.java:138)
at org.apache.cassandra.db.compaction.CompactionTask.runWith(CompactionTask.java:145)
at org.apache.cassandra.io.util.DiskAwareRunnable.runMayThrow(DiskAwareRunnable.java:48)
at org.apache.cassandra.utils.WrappedRunnable.run(WrappedRunnable.java:28)
at org.apache.cassandra.db.compaction.CompactionTask.executeInternal(CompactionTask.java:58)
at org.apache.cassandra.db.compaction.AbstractCompactionTask.execute(AbstractCompactionTask.java:60)
at org.apache.cassandra.db.compaction.CompactionManager$BackgroundCompactionTask.run(CompactionManager.java:211)
at java.util.concurrent.Executors$RunnableAdapter.call(Executors.java:471)
at java.util.concurrent.FutureTask$Sync.innerRun(FutureTask.java:334)
at java.util.concurrent.FutureTask.run(FutureTask.java:166)
at java.util.concurrent.ThreadPoolExecutor.runWorker(ThreadPoolExecutor.java:1145)
at java.util.concurrent.ThreadPoolExecutor$Worker.run(ThreadPoolExecutor.java:615)
at java.lang.Thread.run(Thread.java:722)
In this case we can see tons of these which shows compactions were creating lots of columns.
Once you found compaction to be the issue, try throttling them down and in a high CPU machine, even reduce the number of concurrent_compactors from default to something like half the number of cores.
Reading Large Slices of Wide Rows
Some people criticize having wide rows because they introduce a hotspot into the system. This is true if the key is very active. However, for implementing global secondary indexes for the purpose of pagination, it can be a simple design. However, it should be handled with care. If your application is reading hundreds of columns from a single wide row , it will fill up new generation fast causing promotion failures, and sometimes concurrent mode failures leading to super long GC pauses. The first step to figure out if you have this problem is to look at your Column Family statistics with ‘nodetool cfstats’ command and examine if there is a column family with maximum compacted row size above 10Mb:
<p style="text-align: justify;">Column Family: MySexyCF
SSTable count: 15
SSTables in each level: [1, 4, 10, 0, 0, 0, 0, 0, 0]
Space used (live): 3787762351
Space used (total): 3802583362
SSTable Compression Ratio: 0.34535868204500436
Number of Keys (estimate): 3508992
Memtable Columns Count: 3229
Memtable Data Size: 1506100
Memtable Switch Count: 30
Read Count: 12124
Read Latency: NaN ms.
Write Count: 811644
Write Latency: NaN ms.
Pending Tasks: 0
Bloom Filter False Positives: 53
Bloom Filter False Ratio: 0.00000
Bloom Filter Space Used: 2158960
Compacted row minimum size: 150
Compacted row maximum size: 223875792
Compacted row mean size: 3103
Average live cells per slice (last five minutes): 51.0
Average tombstones per slice (last five minutes): 0.0
In this case, this example CF could be the source of long row. Compacted row maximum size is 223Mb. If a client attempts to read this row entirely, there will definitely be a GC hiccup. The last two lines provide useful information as to how your clients are reading from this column family. Average live cells per slice tells that queries are usually reading 51 columns at a time which is good. If this number it above hundred, depending on the size of data stored inside your columns, you may have the problem and need to tune down your application to read lower number of columns at a time and paginate through.
Rows with lots of Tombstones
When you have rows with dynamic columns and your application deletes those columns, Cassandra will apply a tombstones on those columns until next compaction runs and cleans up expired tombstones passed gc_grace_seconds. When your client does a slice query to read a few columns, even if majority of columns were perviously deleted, Cassandra will have to read and scan all the tombstones in order to find as may non deleted columns as you requested in your slice query. This also causes a major GC pause specially when the number of those tombstones is in hundreds. You can troubleshoot this by looking at ‘nodetool cfstats’. Take the example in previous section, Average tombstones per slice will give you that information. If it is a large value then that is most likely one source for your problem. The following snipper from GC logs shows about 66Mb of DeletedColumn object which could also be a clue:
<p style="text-align: justify;">num #instances #bytes class name
----------------------------------------------
1: 13816038 2089895152 [B
2: 17368263 833676624 java.nio.HeapByteBuffer
3: 4677858 449074368 edu.stanford.ppl.concurrent.CopyOnWriteManager$COWEpoch
4: 7836709 376162032 edu.stanford.ppl.concurrent.SnapTreeMap$Node
5: 8167750 261368000 org.apache.cassandra.db.Column
6: 4736849 227368752 edu.stanford.ppl.concurrent.SnapTreeMap$RootHolder
7: 4677859 149691488 edu.stanford.ppl.concurrent.CopyOnWriteManager$Latch
8: 1720376 117984464 [Ljava.lang.Object;
9: 7023535 112376560 java.util.concurrent.atomic.AtomicReference
10: 2706529 108261160 java.math.BigInteger
11: 2614011 88889152 [I
12: 482884 86773680 [J
13: 3540985 84983640 java.util.concurrent.ConcurrentSkipListMap$Node
14: 2466985 78943520 edu.stanford.ppl.concurrent.SnapTreeMap
15: 3277799 78667176 org.apache.cassandra.db.ColumnFamily
16: 2169005 69408160 org.apache.cassandra.db.DeletedColumn
17: 2586956 62086944 org.apache.cassandra.db.DecoratedKey
18: 2466980 59207520 org.apache.cassandra.db.AtomicSortedColumns$Holder
19: 1627838 52090816 java.util.ArrayList$Itr
20: 2584943 41359088 org.apache.cassandra.dht.BigIntegerToken
To cleanup tombstones, you can lower gc_grace_seconds and force user defined compactions on SSTables in question. [TODO: write an article for this]
Key Cache
Key Caches are very useful, so sometimes people think that if they increase the key cache size portion of the heap, they can help their application. It is true and false. You can increase the key cache size to the point that you are occupying a significant portion of the heap. Since key caches can be long lived if you have hot rows, they can get promoted to the old generation fast. This also limits the amount of space available to other operations like reads, repairs, compactions, and memtables.
Problem with Key Cache Algorithm in Pre Cassandra 1.2
If you are running Cassandra 1.1 or earlier and have set your key cache size to any size, it is a lie. In this case the cluster had 1Gb as Key Cache size. This problem exposes itself quickly if you have a use case like a map-reduce job that reads whole bunch of keys at once. Lets look at the following histogram:
<p style="text-align: justify;">num #instances #bytes Class description
--------------------------------------------------------------------------
1: 18411450 1004061680 byte[]
2: 42400 773751784 long[]
3: 15604278 499336896 java.util.concurrent.ConcurrentHashMap$HashEntry
4: 15603972 499327104 com.googlecode.concurrentlinkedhashmap.ConcurrentLinkedHashMap$Node
5: 17395823 417499752 java.lang.Long
6: 15604024 374496576 org.apache.cassandra.cache.KeyCacheKey
7: 15603973 374495352 com.googlecode.concurrentlinkedhashmap.ConcurrentLinkedHashMap$WeightedValue
8: 2825682 135632736 java.nio.HeapByteBuffer
There are 773Mb of long arrays and over 1Gb of byte arrays and over 15 million Key Cache objects which is in accordance with the number of keys that the cluster had. If you look at Cassandra Code , there is an assumption that keys are 48 Bytes (AVERAGE_KEY_CACHE_ROW_SIZE). This assumption is used to compute the size of key cache consumption in heap. You can quickly make a guess that if your developers have made keys that are longer than 48 Bytes, your key cache can easily use more memory than it should have without you knowing it.
The best solution for this is to not have such a large key cache anyway. The default of 100Mb can hold a lot of keys if you are not crazy to have keys more than 48 Bytes. I usually advise my developers to not have keys more than 32 Bytes. Alternatively, you can disable the key cache entirely for the column families with large keys, or upgrade to Cassandra 1.2 as this issue (CASSANDRA-4315) is fixed.
Row Cache
If you are using Row Cache and you are specially using the old ConcurrentHashCacheProvider, row caches are stored on the heap. For the very same reasons as the previous section, you may run into heap pressure and super long GCs. Therefore use SerializingCacheProvider or turn of Row Cache completely.
Memtables
If you have a write heavy workload, it is usually a good idea to increase the memtable segment of the heap because it absorbs more writes and leads to efficient compactions when flushed to disk. However, on a workload which has more reads than writes, if memtable space is large, it takes room away from heap for other purposes like serving reads. Moreover, if memtables aren’t flushed because the flush threshold is large, they have higher chance of being promoted to the tenured space. Usually when long GCs happen and Cassandra is under a heap pressure, MemoryMeter.java will output useful logs into system.log with details about how much cells where in memtables and from what column family. From that output you can decide if memtables are wasting your heap.
In this scenario, you can reduce memtable_total_space_in_mb in cassandra.yaml. If you have a high write and read workload and you need to optimize for both, you may have to increase the heap size.
Heavy Read/Write Workload
If you have mix of read and writes in the order of a few thousands of each per node, it is usually the case that the default heap settings will not work for you. Due to the high load which is the nature of your cluster (in my case shrinking the load of 26 nodes to 6), the ParNew cycles will happen more frequently. This means that the objects in the young generation that could be anything, columns being read, column being compacted, key caches, memtables, etc will quickly get promoted to the old generation after 1 GC cycle. In this case old generation will fill up faster and you will potentially have more full GCs. Looking at this example:
<p style="text-align: justify;">3109400.009: [ParNew (0: promotion failure size = 9564) (2: promotion failure size = 180075) (3: promotion failure size = 8194) (5: promotion failure size = 8194) (8: promotion failure size = 180075) (9: promotion failure size = 8194) (promotion failed)
Desired survivor size 41943040 bytes, new threshold 1 (max 1)
- age 1: 78953120 bytes, 78953120 total
Notice all object have age of 1. This mean these survived after one ParNew GC round.
In this case, try increasing the value of MaxTenuringThreshold to something bigger. In my case I had to increase it up to 20. This will increase the amount of work ParNew has to do, but it prevents objects from getting promoted quickly. Then in GC logs you can see objects will love longer in the young generation:
<p style="text-align: justify;">3300904.569: [ParNew
Desired survivor size 322109440 bytes, new threshold 16 (max 20)
- age 1: 21130648 bytes, 21130648 total
- age 2: 14694568 bytes, 35825216 total
- age 3: 16107080 bytes, 51932296 total
- age 4: 14677584 bytes, 66609880 total
- age 5: 22870824 bytes, 89480704 total
- age 6: 15780112 bytes, 105260816 total
- age 7: 10447608 bytes, 115708424 total
- age 8: 14478280 bytes, 130186704 total
- age 9: 10581832 bytes, 140768536 total
- age 10: 20488448 bytes, 161256984 total
- age 11: 16537720 bytes, 177794704 total
- age 12: 8377088 bytes, 186171792 total
- age 13: 8877224 bytes, 195049016 total
- age 14: 9803376 bytes, 204852392 total
- age 15: 96226928 bytes, 301079320 total
ParNew auto tunes itself. If it sees more long lived objects, it will increase the TenuringThreshold after each run up to the MaxTenuringThreshold. It it sees objects are expiring faster, it will reduce the TenuringThreshold.
All has failed? You are still seeing promotion failures! Need larger Heap
If you are unlucky like me you have to go to the final resort which some people hate in Cassandra community. You will need more room for your young generation but it is not advised to increase the young generation to more than 1/4 of the total heap size. In fact Java Hotspot won’t start if someone increases the young generation beyond 1/3 of heap space. You need to have larger old generation for healthy promotions. In this case gradually start increasing your heap size and young generation size to the point that you don’t go beyond 1/2 of your available physical memory. I recommend increasing the heap size by 2Gb at a time and adjust the young generation size accordingly. Keep in mind to keep your high value of MaxTenuringThreshold.
The drawback of running Cassandra with larger heap is that your ParNew cycles may take longer but if you have more CPU it will not be a problem. The benefit is majority of your expired objects will be cleaned up in young generation. At the same time you will not super log stop the world pauses.
Conclusion:
In Cassandra Garbage Collector Tuning we learned that it is a tedious task to find out sources of long stop the world garbage collector pauses. Every setup is different, and caution is advised if troubleshooting is to be done on production system. We reviewed the following topics:
- What are stop the world GCs and when are they problematic;
- How the JVM garbage collection works;
- What are signs of stop the world GCs in Cassandra;
- How to troubleshoot and collect information about stop the world pauses;
- What issues in Cassandra use cases will cause long stop the world pauses and how to address each of them;
Now let’s look at the final outcome and compare how I did after the tuning exercises:
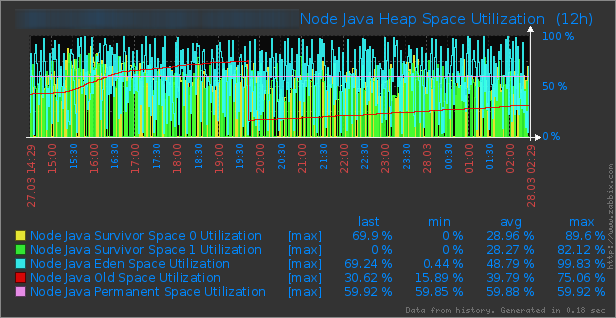
The improvement can be observed quickly. From the Heap Utilization Graph you can see that the maximum heap size was increased to 24Gb and it is utilizing 10Gb on average. You can see the cliff in the graph which is a sign of CMS GC execution, but in the Stop the World GC times graph before 20:00 there no significant GC pause. However, you can see the average GC pauses have gone up a bit since ParNew is cleaning more space. The Heap Space Utilization Graphs shows that the survivors are utilized 28% on average compare to 5% before.
References:
If you like to read more about garbage collector tuning, there are hundreds of articles on the web and I have cherry picked a few which are my favorites here:
- Understanding Jave Garbage Collection
- Practical Garbage Collection
- HotSpot JVM Garbage Collection Cheat Sheet
- Understanding GC pauses in JVM, HotSpot’s Minor GC
- How to tame Java GC pauses, Surviving Heap Sizes of 16Gb and Greater
We are a write intensive system and are running into some GC issues. The above chart depicts our old gen utilization on one of our 12 cassandra nodes. As you can see, we keep see-sawing between 20% – 75% utilization. The 75% number is due to the default value of flushed_largest_memtables_at = 0.75. If we set this setting lower, we are able to see an immediate impact.
My theory is that we are not able to flush the memtables fast enough and therefore build up objects in the old gen until we hit the 75% max at which point, Cassandra flushes the largest memtables. The next thing I did is look at nodetool tpstats to see if the flush writers were blocked, and saw that the “All Time Blocked” to “Completed” ratio is about 0.45. I tried jacking up the flush writers and this number went down, but this still did not have any impact on our old gen utilization pattern.
Our Settings:
Each node is 16G with YoungGen = 4G and OldGen=8G. Memtable size = 5G (around 1/3rd of heap size). Commit Log = 1G. memtable_flush_writers=16.
What am I missing?
Sorry for the late reply. If you have not figured things out, I recommend reducing the memtable size and commit log if you don’t have disk IO issues. Your memtable size is 5G which is larger than 4G YoungGen you chose. So, you would definitely get lots of memtable data pushed to OldGen. Also the memtable_flush_writers of 16 seems a bit too much. If you machine doesn’t have enough CPU and disk IO, you are telling it to saturate itself by holding at least 16 memtables in memory and maintain 16 flush writers which will be blocked by IO (in case of slow disk) and potentially things get accumulated in memory. The blocked flush threads suggest that you ran out of IO bandwidth hence proving the point.
This article was extremely helpful for scaling Cassandra under extreme read/write load in a real time bidding environment. We analyzed gc logs and determined we were having significant premature tenuring leading to promotion failures. For us, a combination of increasing max tenure threshold and increasing the young generation size produced excellent results at full load. We were concerned about increasing the size of the young generation, but our minor GC events suffered very little increase in time and now happen FAR less often, bringing sanity to tenuring.
Thanks man, great stuff. Helped me a lot with my GC-stressed C*’s
Can you please tell me how I can change the Garbage Collector(Lets say I need to use Concurrent Mark Sweep) in Cassendra?
Those are in cassandra-env.sh
https://github.com/apache/cassandra/blob/trunk/conf/cassandra-env.sh#L276
Would you be willing to create/share your Cassandra template for Zabbix?
I want to use jstat for analyzing GC for my Cassandra database. I want to know how can I do this using jstat. I am not able to use jstat. When I am trying to run jsat it says Command not found. please tell me the way out.